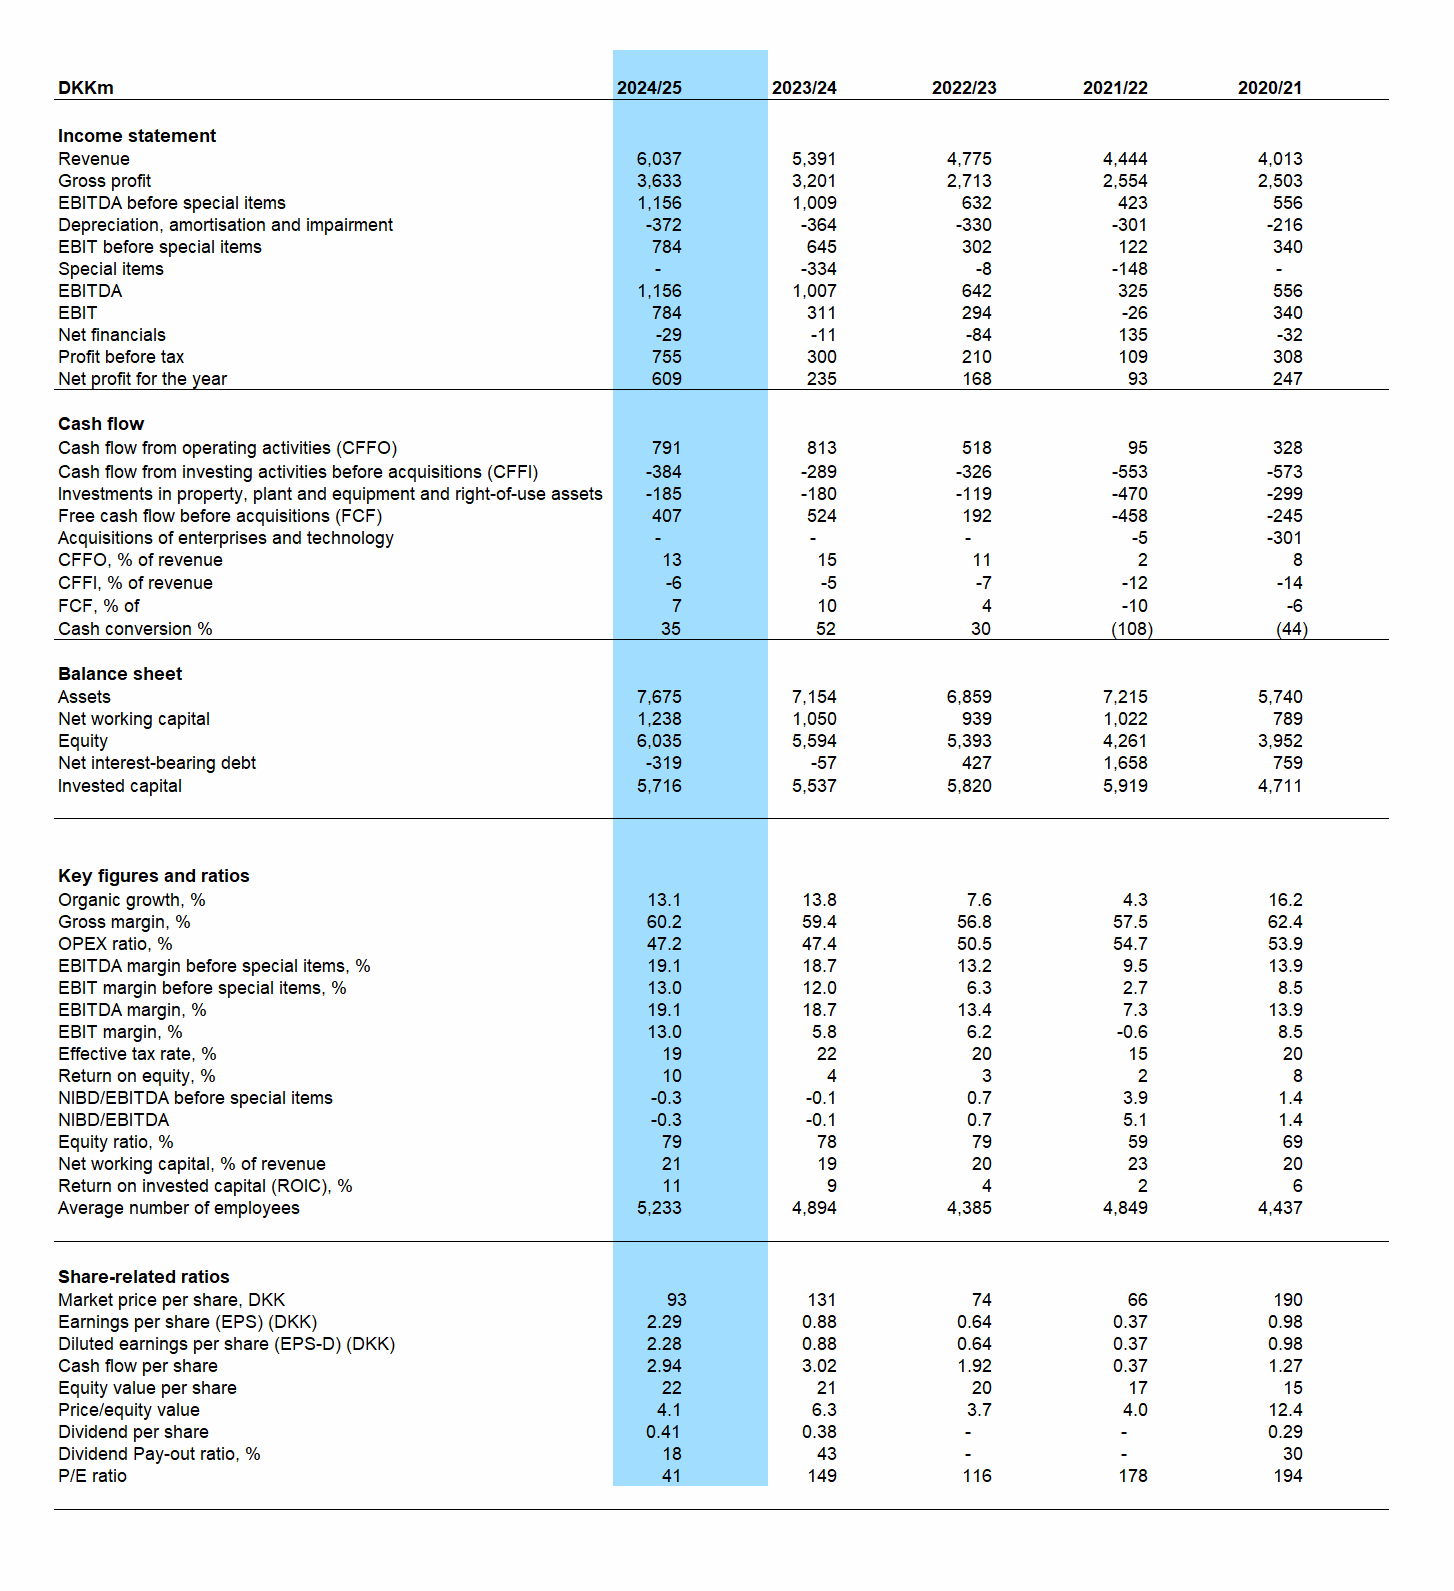
Annual key figures
Download to Excel: Annual key figures 2024/25
- EBITDA: Operating profit before ordinary depreciation, amortisation and special items.
- EBITDA margin: EBITDA before special items in % of revenue.
- EBIT margin: Operating profit before special items in % of revenue.
- Rate of cost: Capacity costs relative to revenue.
- Capacity costs: Selling, development and management costs, administrative expenses and other operating income and expenses.
- Return on equity: Ordinary profit after tax in relation to average equity.
- NIBD: Net interest-bearing debt.
- Equity ratio: Equity’s share of total liabilities at year-end.
- Working capital: Non-monetary current liabilities less non-monetary current assets.
- ROIC: EBIT before special items less tax in relation to assets less non-interest-bearing debt.
- Cash flow per share: Cash flow from operating activities relative to number of shares at year-end.
- Equity value per share: Total equity relative to number of shares at year-end.
- Dividend per share: Dividend relative to number of shares at year-end.
- Pay-out ratio: Dividend declared as a percentage of profit for the year.
- P/E ratio: Market price relative to earnings per share.
- Earnings per share (EPS) and diluted earnings per share (EPS-D) are calculated in accordance with IAS 33.